Graphical functions in floodam.cba
floodam.cba provides dedicated plotting functions sharing a unified interface for language selection and file export:
-
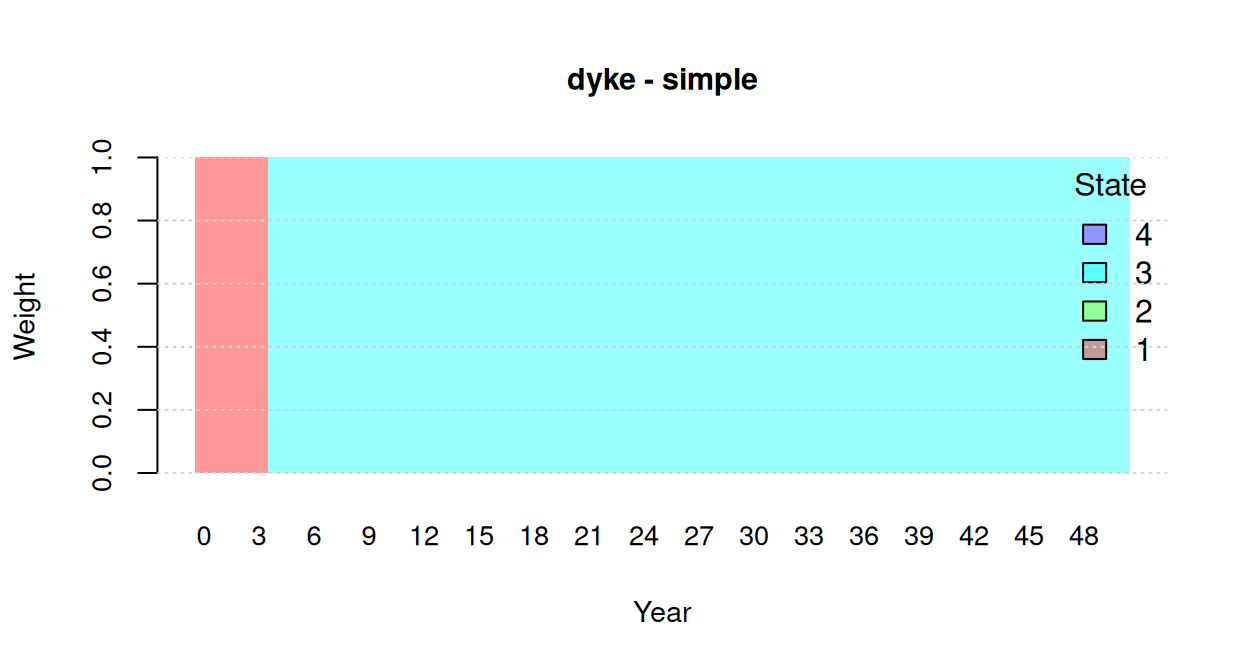
plot_calendar_state(): displays the annual sequence of states of nature visited by a project in a Case object (deterministic "simple" or "probabilistic" calendar);
-
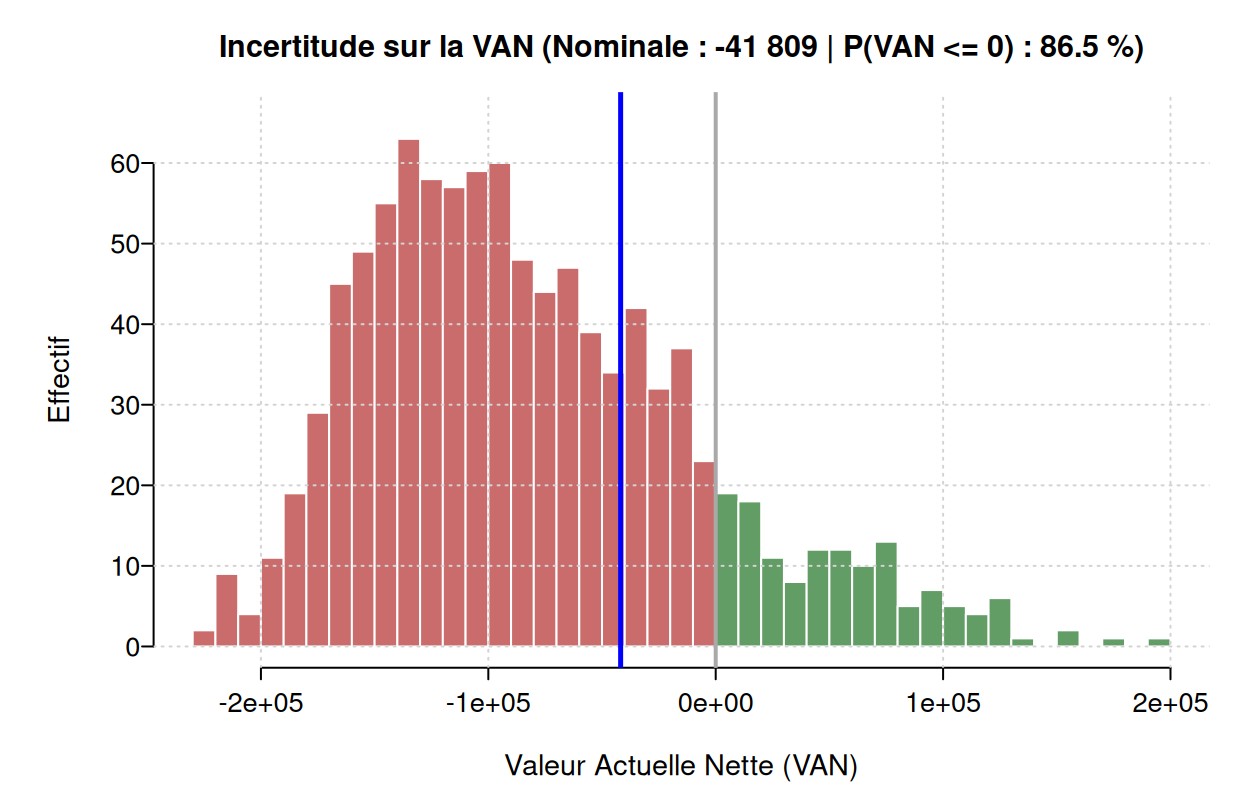
plot() / plot_sa(): main entry point for "cba_uncertainty" objects, dispatching to:
path = system.file("extdata", "case", "simple.ods", package = "floodam.cba")
case = import_case(path)
#> import Case from /usr/local/lib/R/site-library/floodam.cba/extdata/case/simple.ods
#>  ... done
plot_calendar_state(case, project = "dyke", legend = "inline")
Language management (lang and label_graphic)
All graphical functions accept a lang argument (default "en") to localize titles, axis labels, and legends.
Translations are stored in the package dataset label_graphic, covering 11 languages identified by their ISO 639-1 codes:
names(label_graphic[["common"]][["npv"]])
#>  [1] "en" "fr" "es" "it" "de" "pt" "zh" "ja" "ru" "ar" "hi"
-
"en" (English)
-
"fr" (French)
-
"es" (Spanish)
-
"it" (Italian)
-
"de" (German)
-
"pt" (Portuguese)
-
"zh" (Chinese)
-
"ja" (Japanese)
-
"ru" (Russian)
-
"ar" (Arabic)
-
"hi" (Hindi)
If an unsupported language code is requested (or if a specific tag is missing for a language), floodam.cba automatically falls back to "en".
Note
The multilingual labels in label_graphic were translated “automatically” and have not all been reviewed by native domain experts. All feedback, corrections, or suggestions for improvement are very welcome!
Example switching between English and French on plot_calendar_state() and plot():
dyke_sa = perform_sa(case, "dyke", n = 500)
#> Model EAD: 5250
#> Model NPV: -41810
#> Registered S3 method overwritten by 'sensitivity':
#>   method    from
#>   print.src dplyr
#> Evaluating sa_model ...
#>  ... Elapsed time: 0.001504183 secs
#> Sensitivity analysis is performed using sensitivity::sobolmartinez
#> Evaluating sa_sobol ...
#>  ... Elapsed time: 0.3038583 secs
plot(dyke_sa, type = "uncertainty", lang = "fr")
A4-calibrated file export (device and dir_output)
Every plotting function shares the device and dir_output arguments:
-
device: one of "active" (default, draws on the active graphics device), "pdf", "png", "jpg", "jpeg", or "svg";
-
dir_output: target directory when device != "active" (default tempdir()).
When saving to a file:
- Dimensions and base font size (
pointsize = 10) are calibrated for direct 1:1 inclusion in an A4 report without post-scaling (e.g. inches for plot_sa_triplet(), inches for plot_sa(..., type = "both"), or inches for single plots);
- The output filename is standardized as
<case>-<project>-<graphic>-<lang>.<ext>;
- No empty screen graphics window is opened;
- A console message reports the saved path, and the function returns the file path invisibly:
out_path = plot(
  dyke_sa,
  type = "triplet",
  lang = "en",
  device = "pdf",
  dir_output = tempdir()
)