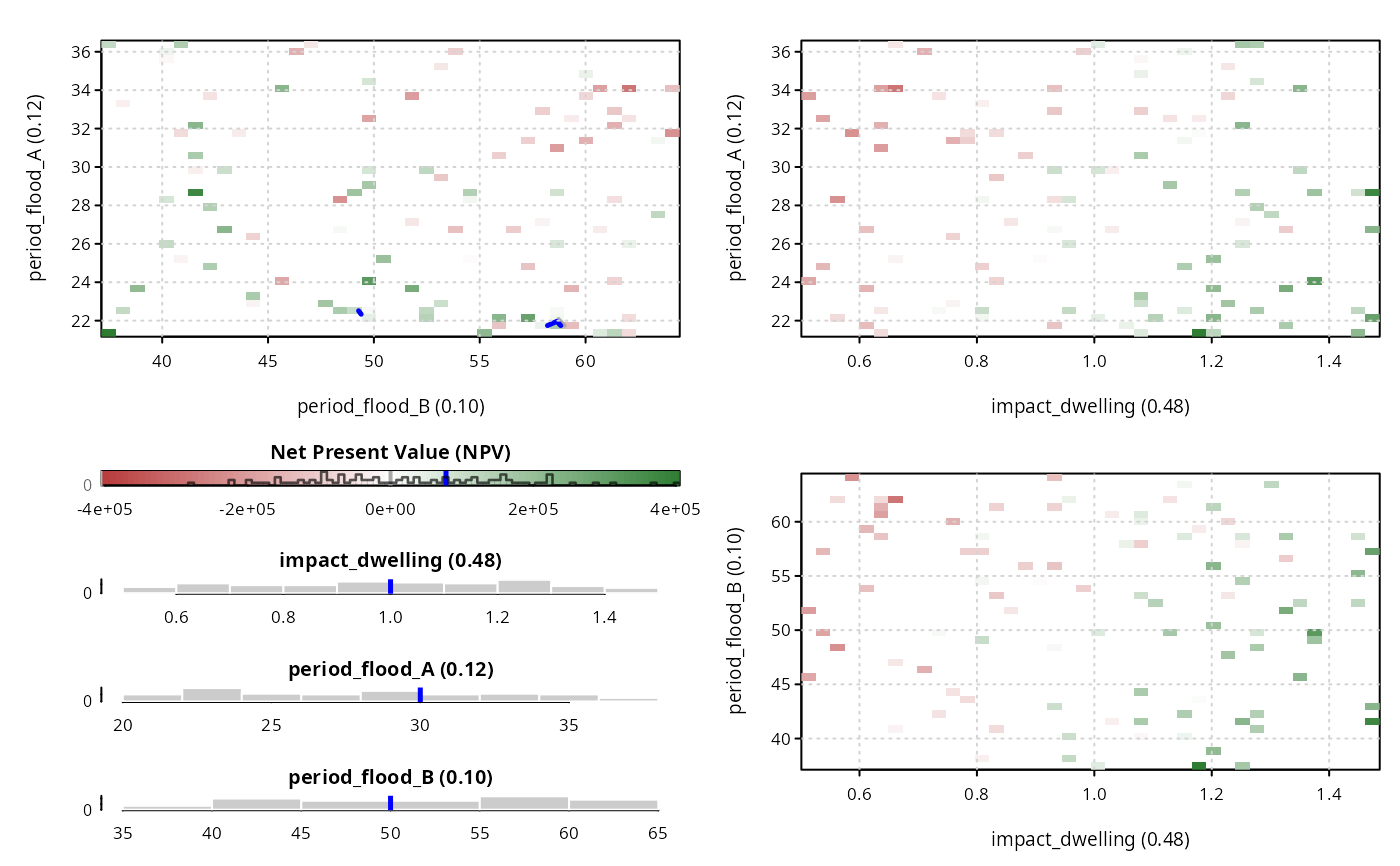
Plot multi-panel sensitivity maps for top three influential parameters
plot_sa_triplet.RdProduce a comprehensive multi-panel graphic displaying 2D response surfaces and marginal distributions for the three most influential parameters identified by Sobol sensitivity analysis.
Usage
plot_sa_triplet(
  x,
  sobol = NULL,
  target = c("npv", "benefit"),
  sobol_order = c("total", "first"),
  distrib = c("hist", "density", "none"),
  lang = "en",
  dir_output = tempdir(),
  device = c("active", "pdf", "png", "jpg", "jpeg", "svg"),
  nominal_col = "blue",
  nominal_lty = 1,
  nominal_lwd = 2.5,
  nbin = 40,
  fun = mean,
  neg = "#B83B3B",
  pos = "#2E7D32",
  n_half = 50,
  ...
)
Arguments
- x
An object of class
cba_uncertainty(as returned byperform_sa()), or a data frame containing simulation outputs.- sobol
Optional named numeric vector of sensitivity indices used to identify the top 3 parameters. If
NULLandxis acba_uncertaintyobject, extracted automatically fromx[["s_a"]].- target
Character scalar, target indicator to analyze:
"npv"(default) or"benefit".- sobol_order
Character scalar, index type used to rank parameters:
"total"(default) or"first".- distrib
Character scalar, distribution type displayed on the central colorbar:
"hist"(default),"density", or"none".- lang
Character scalar, language for labels:
"en"(default), with 11 ISO 639-1 languages supported.- dir_output
Character scalar, destination directory for exported files (defaults to
tempdir()). Ignored whendevice = "active".- device
Character scalar specifying the graphics device:
"active"(default),"pdf","png","jpg","jpeg", or"svg".- nominal_col
Color of the line indicating the nominal value (default is
"blue").- nominal_lty
Line type for the nominal line (default is 1, solid).
- nominal_lwd
Line width for the nominal line (default is 2.5).
- nbin
Integer scalar, number of bins per parameter axis for 2D aggregation (default is 40).
- fun
Summary function applied to target values within each 2D bin (default is
mean()).- neg
Color specification for negative values in the diverging color scale (default is
"#B83B3B").- pos
Color specification for positive values in the diverging color scale (default is
"#2E7D32").- n_half
Integer scalar, number of color steps on each half of the zero boundary (default is 50).
- ...
Additional arguments passed to graphical methods.
Value
An invisible character scalar giving the path of the generated file
when device != "active", or invisible NULL when device = "active".
Details
The graphic arranges:
Three 2D response surfaces (
graphics::image()andgraphics::contour()) for pairs of the top 3 parameters \((v_1, v_2)\), \((v_3, v_2)\), and \((v_1, v_3)\).Contour lines for \(\text{target} = 0\) and for the nominal target value.
A central color legend bar with optional histogram or density of the target indicator.
Marginal histograms for each of the three parameters, indicating their nominal values.
When device != "active", the figure is exported into dir_output as
<case>-<project>-sa_triplet_<target>-<lang>.<device>.
See also
Other sensitivity analysis:
format_flood(),
format_sector(),
perform_sa(),
plot_sa(),
plot_sobol(),
plot_uncertainty(),
prepare_sa(),
prepare_sa_calendar(),
prepare_sa_cost(),
prepare_sa_flood(),
prepare_sa_impact(),
prepare_uncertainty(),
prop_negative()
Author
Frédéric Grelot, frederic.grelot.1994_cran@m4x.org
Examples
case = import_case(
    system.file("extdata", "case", "simple.ods", package = "floodam.cba")
)
#> import Case from /tmp/RtmpvMoJJK/temp_libpath2b69f6f14b9e9/floodam.cba/extdata/case/simple.ods
#>  ... done
res = perform_sa(case, n = 50, verbose = FALSE)
plot_sa_triplet(res, target = "npv")