Plot Sobol sensitivity indices for CBA parameters
plot_sobol.RdHorizontal barplot of variance-based Sobol sensitivity indices (first-order \(S\), total-order \(T\), or both) for parameters influencing NPV or annual benefit.
Usage
plot_sobol(
  x,
  indicator = c("npv", "benefit"),
  sobol_order = c("both", "total", "first"),
  lang = "en",
  dir_output = tempdir(),
  device = c("active", "pdf", "png", "jpg", "jpeg", "svg"),
  col_family = c(cost = "#2E7D32", period = "#E65100", hydraulic = "#1565C0", impact =
    "#6A1B9A", other = "gray50"),
  show_ci = TRUE,
  main = NULL,
  ...
)
Arguments
- x
An object of class
cba_uncertainty(as returned byperform_sa()), or a list containing Sobol results (s_a).- indicator
Character scalar, target indicator:
"npv"(default) or"benefit".- sobol_order
Character scalar, indices to display:
"both"(default),"total", or"first".- lang
Character scalar, language for labels:
"en"(default), with 11 ISO 639-1 languages supported.- dir_output
Character scalar, destination directory for exported files (defaults to
tempdir()). Ignored whendevice = "active".- device
Character scalar specifying the graphics device:
"active"(default),"pdf","png","jpg","jpeg", or"svg".- col_family
Named character vector of colors for each parameter group (
cost,period,hydraulic,impact,other).- show_ci
Logical scalar indicating whether to plot bootstrap confidence intervals (default is
TRUE).- main
Optional character scalar to override the title.
- ...
Additional arguments passed to
graphics::barplot().
Value
An invisible character scalar giving the path of the generated file
when device != "active", or invisible NULL when device = "active".
Details
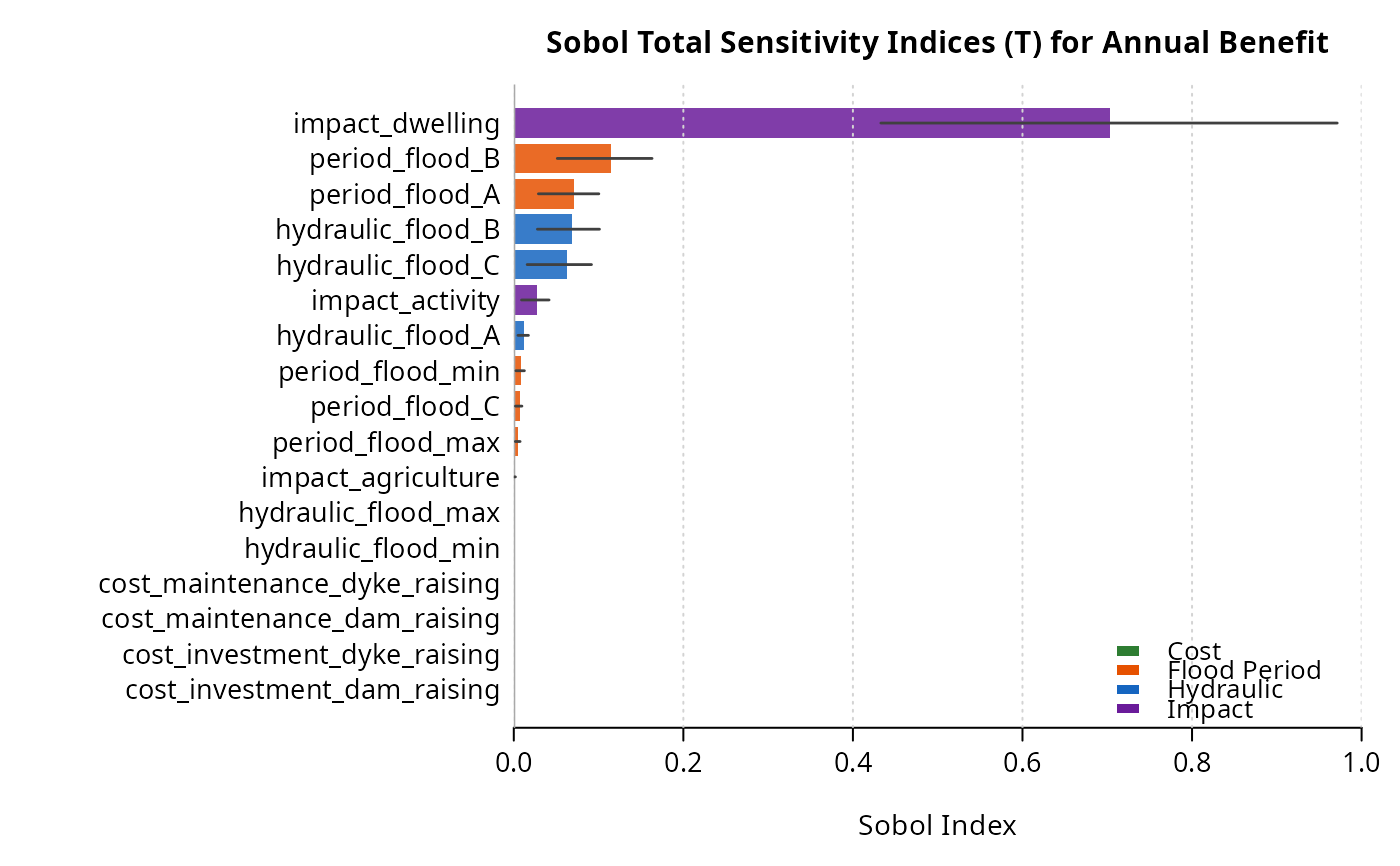
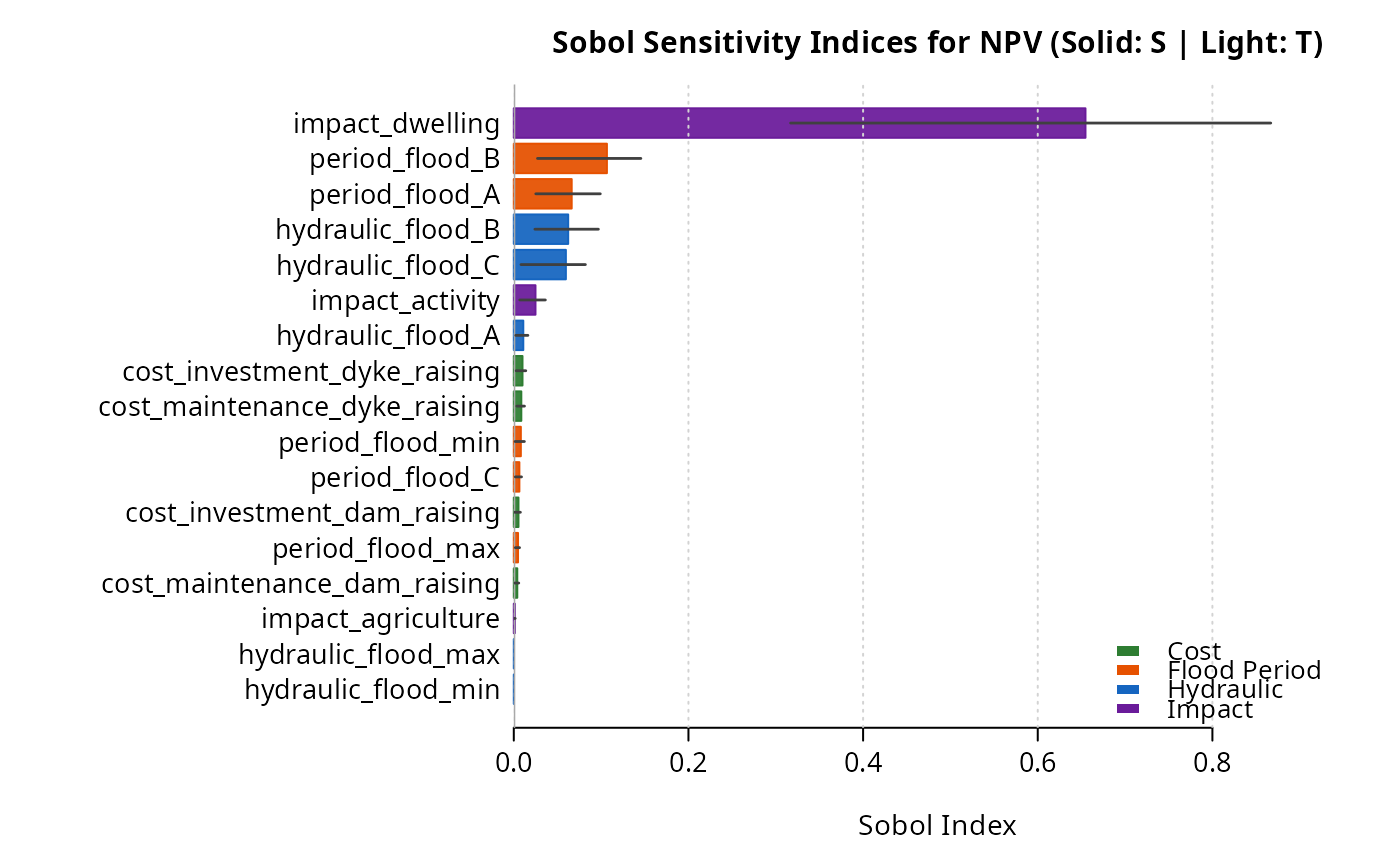
Parameters are ranked by sensitivity index and color-coded by parameter family (costs, flood hazard return periods, hydraulic efficiencies, and damage impacts).
When sobol_order = "both", total indices are displayed as light background
bars and first-order indices as solid overlaid bars. Confidence intervals (if
computed by the Sobol estimator) are shown as segments.
When device != "active", the figure is exported into dir_output as
<case>-<project>-sobol_<indicator>-<lang>.<device>.
See also
Other sensitivity analysis:
format_flood(),
format_sector(),
perform_sa(),
plot_sa(),
plot_sa_triplet(),
plot_uncertainty(),
prepare_sa(),
prepare_sa_calendar(),
prepare_sa_cost(),
prepare_sa_flood(),
prepare_sa_impact(),
prepare_uncertainty(),
prop_negative()
Author
Frédéric Grelot, frederic.grelot.1994_cran@m4x.org
Examples
case = import_case(
system.file("extdata", "case", "simple.ods", package = "floodam.cba")
)
#> import Case from /tmp/RtmpvMoJJK/temp_libpath2b69f6f14b9e9/floodam.cba/extdata/case/simple.ods
#> ... done
res = perform_sa(case, n = 50, verbose = FALSE)
plot_sobol(res, indicator = "npv")
 plot_sobol(res, indicator = "benefit", sobol_order = "total")