Plot uncertainty distribution of CBA indicators
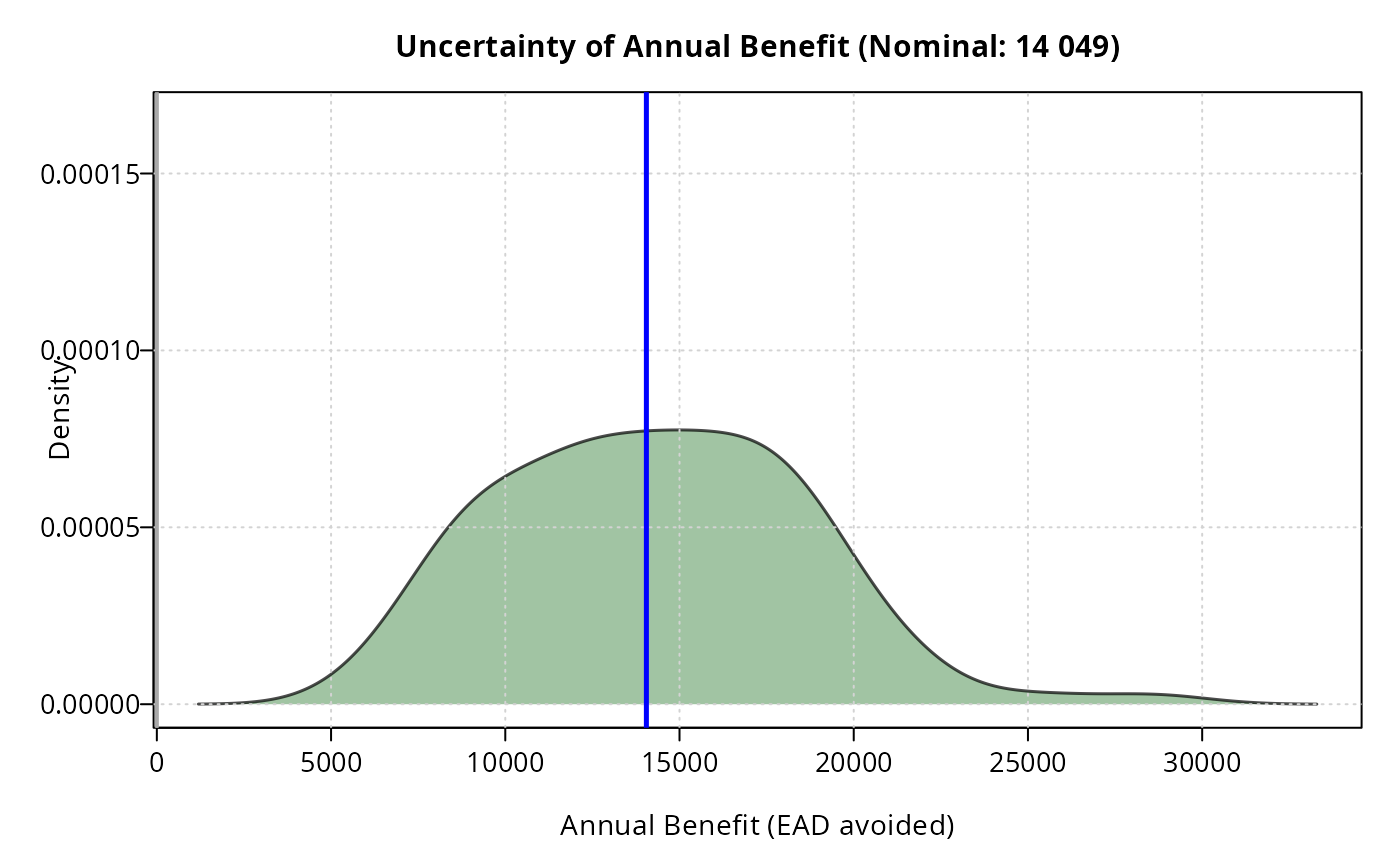
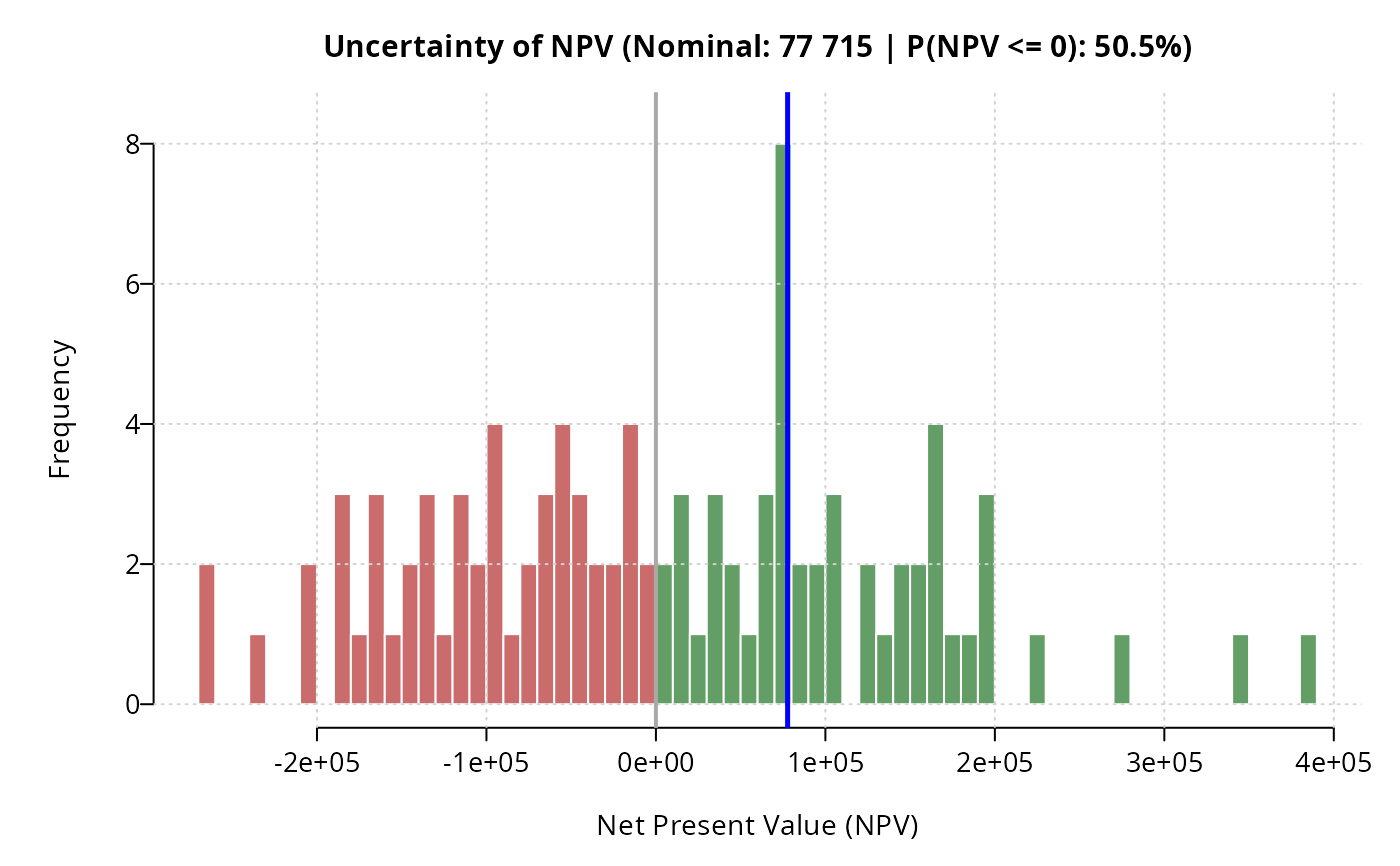
plot_uncertainty.RdPlot the empirical distribution (histogram, kernel density, or both) of CBA indicators (NPV or annual benefit) obtained from Monte Carlo uncertainty analysis.
Usage
plot_uncertainty(
  x,
  indicator = c("npv", "benefit"),
  distrib = c("hist", "density", "both"),
  lang = "en",
  dir_output = tempdir(),
  device = c("active", "pdf", "png", "jpg", "jpeg", "svg"),
  neg = "#B83B3B",
  pos = "#2E7D32",
  nominal_col = "blue",
  nominal_lty = 1,
  nominal_lwd = 2.5,
  breaks = 50,
  main = NULL,
  xlab = NULL,
  ...
)
Arguments
- x
An object of class
cba_uncertainty(as returned byperform_sa()), or a data frame containing simulation outputs (u_a).- indicator
Character scalar, target indicator to display:
"npv"(default) or"benefit".- distrib
Character scalar specifying the representation style:
"hist"(default, frequency histogram),"density"(shaded kernel density), or"both"(histogram with overlaid density line).- lang
Character scalar, language for labels:
"en"(default), with 11 ISO 639-1 languages supported.- dir_output
Character scalar, destination directory for exported files (defaults to
tempdir()). Ignored whendevice = "active".- device
Character scalar specifying the graphics device:
"active"(default),"pdf","png","jpg","jpeg", or"svg".- neg
Color specification for negative values (default is
"#B83B3B").- pos
Color specification for positive values (default is
"#2E7D32").- nominal_col
Color of the vertical line indicating the nominal value (default is
"blue").- nominal_lty
Line type for the nominal line (default is 1, solid).
- nominal_lwd
Line width for the nominal line (default is 2.5).
- breaks
Number of histogram bins (default is 50), passed to
graphics::hist().- main
Optional character scalar to override the plot title.
- xlab
Optional character scalar to override the x-axis label.
- ...
Additional graphical arguments passed to plotting methods.
Value
An invisible character scalar giving the path of the generated file
when device != "active", or invisible NULL when device = "active".
Details
Displays the simulated distribution of the selected indicator with differentiated colors for negative (unprofitable) and positive values.
The nominal baseline value is highlighted with a vertical line. For NPV, the estimated probability of a non-positive outcome (\(P(\text{NPV} \le 0)\)) is displayed in the title.
When device != "active", the figure is exported into dir_output as
<case>-<project>-uncertainty_<indicator>-<lang>.<device>.
See also
Other sensitivity analysis:
format_flood(),
format_sector(),
perform_sa(),
plot_sa(),
plot_sa_triplet(),
plot_sobol(),
prepare_sa(),
prepare_sa_calendar(),
prepare_sa_cost(),
prepare_sa_flood(),
prepare_sa_impact(),
prepare_uncertainty(),
prop_negative()
Author
Frédéric Grelot, frederic.grelot.1994_cran@m4x.org
Examples
case = import_case(
system.file("extdata", "case", "simple.ods", package = "floodam.cba")
)
#> import Case from /tmp/RtmpvMoJJK/temp_libpath2b69f6f14b9e9/floodam.cba/extdata/case/simple.ods
#> ... done
res = perform_sa(case, n = 50, verbose = FALSE)
plot_uncertainty(res, indicator = "npv")
 plot_uncertainty(res, indicator = "benefit", distrib = "density")