Plot calendar state transitions or probabilities
plot_calendar_state.RdPlot the sequence or distribution of states of nature over time for a given project, supporting both deterministic (simple) and probabilistic calendars.
Arguments
- x
An object of class
Case.- type
Character scalar specifying the calendar type:
"simple"(default) or"probabilistic".- project
Character scalar, name of the project whose calendar is plotted (defaults to
"baseline").- color
Optional vector of colors for each state of nature. If named, names must match the state names in
x["characteristic"][["state"]]. IfNULL(default), semi-transparent rainbow colors are used.- legend
Character scalar specifying legend mode:
"none"(default),"only"(renders only the legend on a blank canvas), or"inline"(adds the legend to the barplot).- lang
Character scalar, ISO 639-1 language code for localized labels (defaults to
"en", 11 languages supported).- dir_output
Character scalar, destination directory for exported files (defaults to
tempdir()). Ignored whendevice = "active".- device
Character scalar specifying the graphics device:
"active"(default, render to active device),"pdf","png","jpg","jpeg", or"svg".- main
Optional character scalar to override the plot title. If
NULL(default), formatted as"<project> - <type>".- xlab
Optional character scalar to override the x-axis label.
- ylab
Optional character scalar to override the y-axis label.
- ...
Additional arguments forwarded to
graphics::barplot().
Value
An invisible character scalar giving the path of the generated file
when device != "active", or invisible NULL when device = "active".
Details
The function extracts the calendar schedule for project from x["calendar"]
and plots:
For
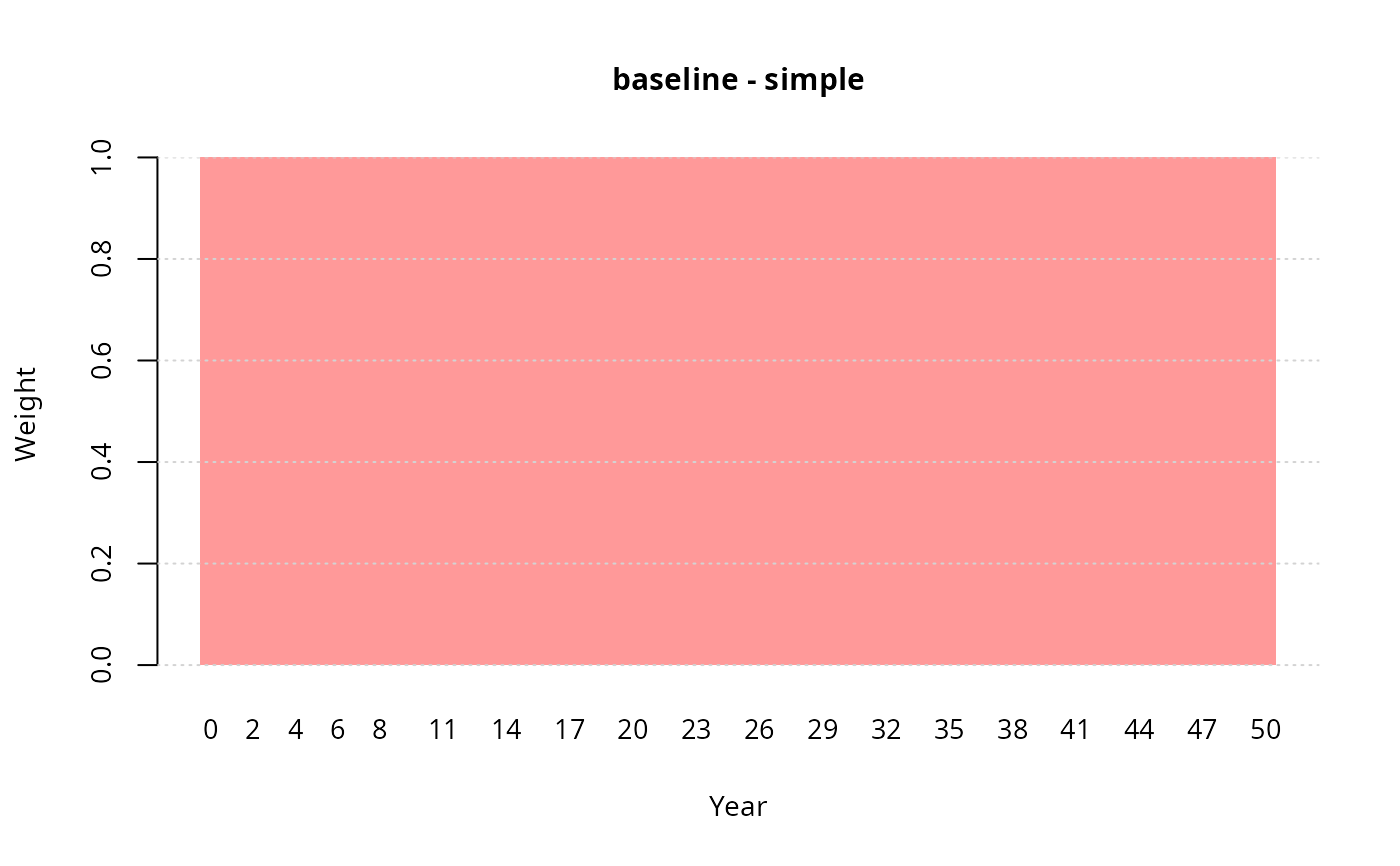
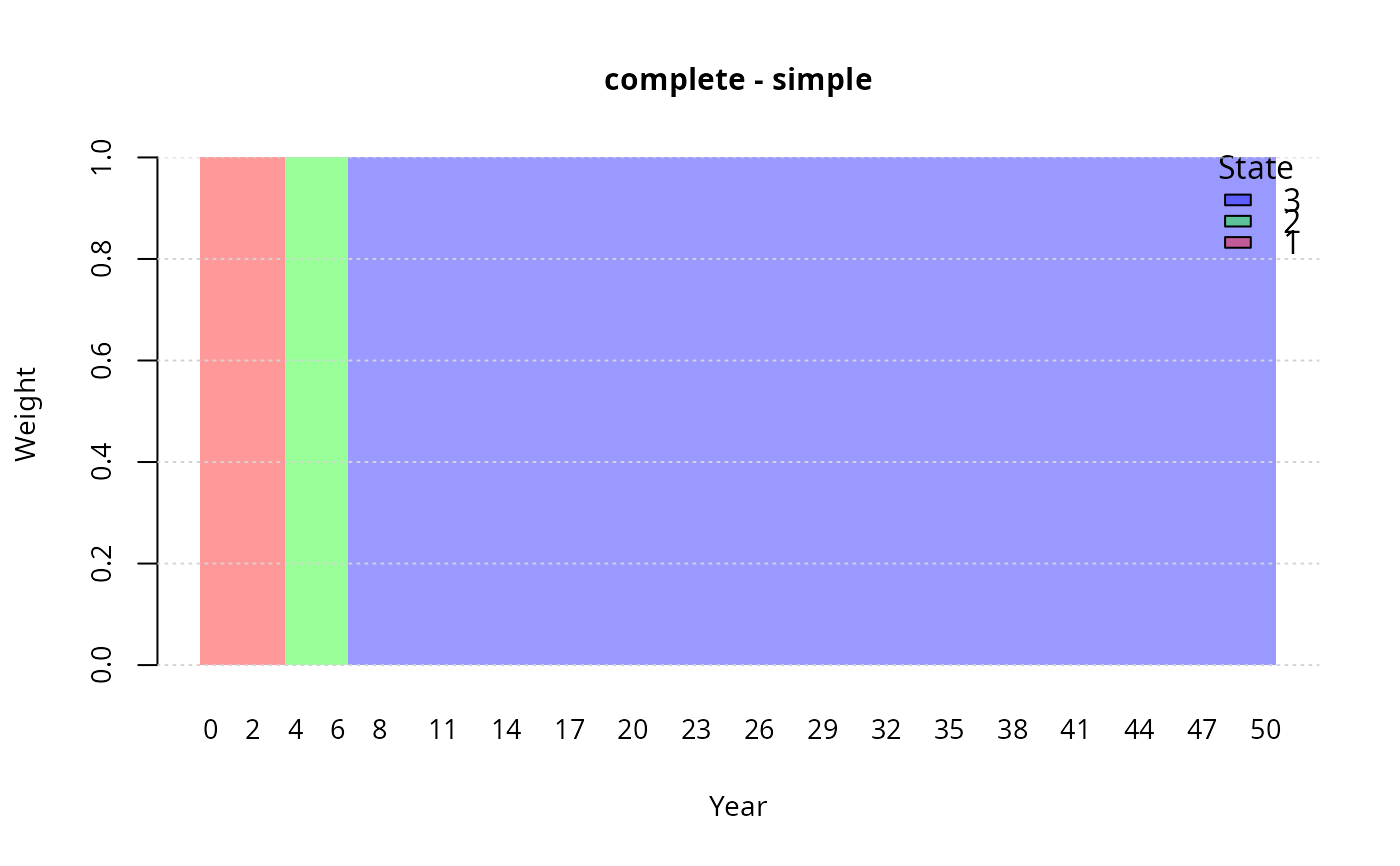
type = "simple": A stacked barplot showing the discrete state of nature occupied by the system in each year of the simulation horizon.For
type = "probabilistic": A stacked barplot showing the probability distribution across states of nature for each year.
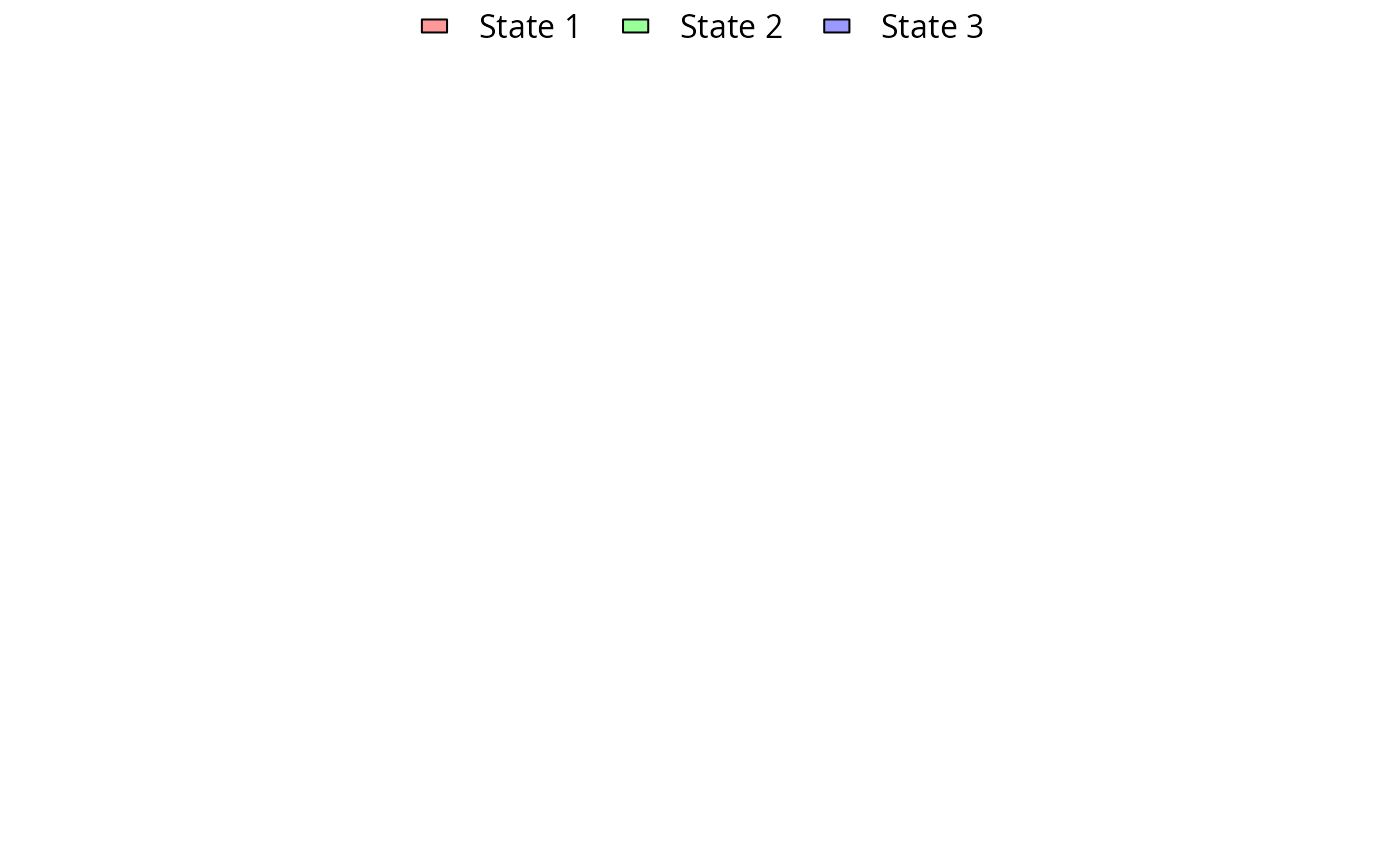
If legend = "only", the function renders a standalone horizontal legend in
a blank canvas, which is useful when assembling multi-panel composite figures.
If legend = "inline", an in-plot legend is placed at the top-right corner.
Localized axis labels, titles, and legend labels are queried from label_graphic
via get_label() using the ISO 639-1 language code provided in lang.
When device != "active", the figure is exported into dir_output as
<case>-<project>-calendar_state-<lang>.<device>.
Author
Frédéric Grelot, frederic.grelot.1994_cran@m4x.org
Examples
case = import_case(
system.file("extdata", "case", "complete.ods", package = "floodam.cba")
)
#> import Case from /tmp/RtmpvMoJJK/temp_libpath2b69f6f14b9e9/floodam.cba/extdata/case/complete.ods
#> ... done
# Plot simple deterministic calendar for baseline
plot_calendar_state(case, type = "simple", project = "baseline")
 # Plot simple calendar with inline legend for a project
proj = setdiff(case["project", "name"], "baseline")[1]
plot_calendar_state(case, type = "simple", project = proj, legend = "inline")
 # Standalone legend
plot_calendar_state(case, legend = "only")